
Using Go High Level’s Website Analytics to Make Better Design Decisions
In today’s digitally-driven world, your website is not just a digital business card—it’s the center of your online marketing ecosystem. But how do you know your beautifully designed website is actually working? According to a recent survey, over 80% of users will leave a website if the user experience is poor or confusing. That’s where Go High Level’s built-in website analytics steps in, offering real-time insights that can transform the way you design and optimize your funnels and web pages.
This article explores how to harness Go High Level analytics as a powerful tool for boosting your website’s performance. Whether you are an entrepreneur launching funnels, a marketer managing campaigns, or a business owner trying to maximize your website ROI, this comprehensive guide will teach you how to read, interpret, and take action using reliable data. By the end of this article, you will understand how to use Go High Level analytics to drive smarter design decisions that attract, engage, and convert.
Understanding the Concept: Definition and Key Concepts
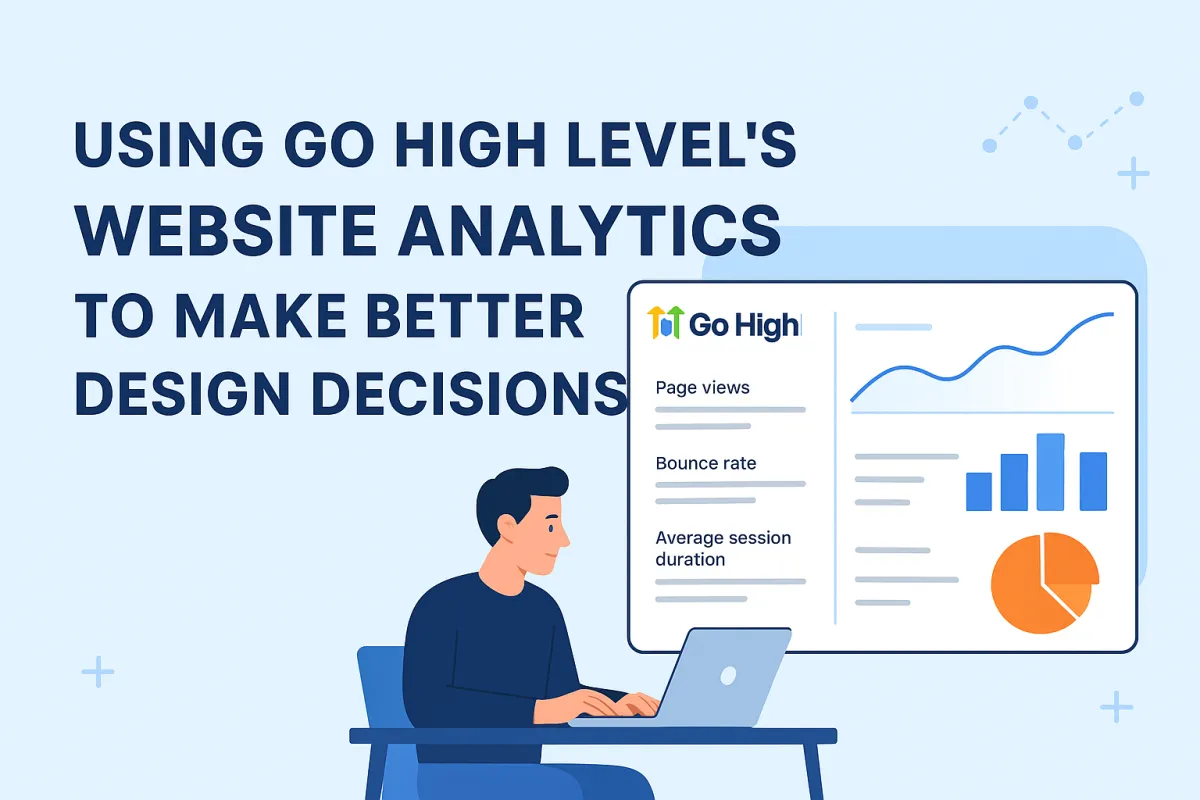
Go High Level (often stylized as GoHighLevel or GHL) is an all-in-one sales and marketing platform designed to consolidate tools like CRM, landing pages, email marketing automation, appointment scheduling, and, yes, website and funnel analytics. At its core, Go High Level’s website analytics is a centralized dashboard that collects and visualizes a wide range of performance KPIs—page views, bounce rate, time on site, conversions, and more.
Evolution of Go High Level Analytics
Initially built to serve digital marketing agencies, Go High Level has evolved into a platform capable of replacing entire tech stacks with one login. The analytics capabilities were extended in 2022 to support deeper funnel/tracking integrations, and by 2024, features like real-time traffic data, customizable dates, graph-based insights, and multichannel attribution had made Go High Level a viable competitor to standalone analytics platforms.
Advantages of Using Go High Level Analytics
💡 Unified insights into all your funnel and website data
💡 Visual and easy-to-interpret performance reports
💡 Conversion metrics directly tied to campaign efforts
💡 Behavior tracking to adjust and optimize UX/UI elements
Let’s unpack what makes these features so useful and how you can use them to build high-converting websites.
Why It Matters for Today’s Businesses
The average landing page conversion rate across industries is only 2.35%. That means without strategic data-backed improvements, 97 out of every 100 visitors will walk away. Relying on guesswork for page design or funnel decisions can result in lost leads, lower ROI, and missed growth opportunities.
Understanding and applying Go High Level’s website analytics allows businesses to:
Identify high-dropoff pages and optimize them.
Refine CTAs (call-to-actions) based on conversion hotspots.
Detect UX issues like confusing layouts or slow-loading elements.
Align design with traffic sources (social, email, PPC) for better targeting.
Real-World Illustration
Take the case of an eCommerce store owner using Go High Level to monitor a sales funnel. After using the analytics dashboard, they observe that 80% of visitors abandon the funnel at the second page. Further behavior insights show low engagement on a video embed. Redesigning that component and streamlining the checkout process improved their conversions by 24% in just three weeks.
(Related resource: How User Experience Impacts Sales Funnel Success)
Key Features of Go High Level Website Analytics
Unified Funnel and Website Analytics Dashboard
Unlike piecemeal tools that require stitching data from various sources, Go High Level centralizes analytics across all your funnels and sites. The dashboard offers:
A real-time overview of user activity
Historical performance data for trends
Drill-down capabilities by funnel, landing page, or campaign
Visitor Behavior Insights
Analyze important behavioral metrics, including:
Page Views
Unique Visitors
Time-on-Page
Entry and Exit Pages
These metrics help answer questions like:
Which pages retain attention?
Where are visitors dropping off?
What content gets the most engagement?
Conversion Tracking
This feature allows you to track:
Opt-in forms
Sales
Appointments
Order form completions
Tracking helps identify bottlenecks in your funnel, allowing you to revise layout, CTA buttons, form length, or service copy where necessary.
Customizable Date Ranges and Timelines
Need to compare last month’s performance to this month? The fully adjustable timeline lets you pull insights over any period, helping analyze:
Traffic spikes from campaigns
Seasonal user behavior
Long-term UX and performance trends
How to Use Go High Level Analytics for Design Decisions
The art of data-driven design means translating numbers into actionable improvements. Here's how to do it.
Accessing the Analytics Dashboard
To begin, navigate to:
Sites → Analytics
From here, select the desired funnel or website. You can filter by specific date ranges, use visual graphs to identify trends, and even toggle between real-time and historical data analysis.
Interpreting Key Metrics for Design Improvement
Here are practical design adjustments based on core metrics:
High Bounce Rate? Simplify your homepage. Employ quick-loading visuals and clear navigation.
Short Time on Page? Improve content relevance or user engagement with videos, carousels, or FAQs.
Poor Conversion? A/B test CTA placements and update button text color or font for higher visibility.
Leveraging Attribution and Source Reports
If most of your traffic comes from social, design elements like messaging and image dimensions should reflect platform standards. Likewise, if traffic originates from Google Ads, optimizing headline alignment with ad copy enhances trust and continuity.
(Related article: The Psychology of Effective Web Design for Ads)
Benefits of Using Go High Level Analytics for Website Design
Data-Driven Decision-Making
Designing based on intuition has its limits. Real-time data pinpoints what’s working and what's not—a strategic advantage that continuously feeds into an agile web improvement loop.
Improved Conversion Rates
Minor changes, like a better-formatted testimonial or a cleaner checkout form, can significantly boost ROI. Insights from GHL help uncover those opportunities with precision.
Centralized Reporting Saves Time
Instead of jumping between tools (e.g., Heatmaps, Google Analytics, CRM), Go High Level connects the dots—reducing complexity and speeding up action.
Advanced Integration and Reporting Features
Integration with Google and Facebook Ads
Go High Level can track advertising ROI across campaigns. You’ll get a correlation between:
Ad Spend and Conversions
Click-through Rates and Landing Page Duration
Best-performing Ad Sources by Design/Copy Type
Appointment and Call Reporting
Track how well your design choices impact scheduling and inbound calls. Use the data to:
Increase calendar visibility
Correct UX issues preventing appointment bookings
Reduce bounce by showcasing trust and testimonials
Best Practices for Maximizing Go High Level Analytics
Analyze weekly trends and user behaviors
Identify segments (mobile vs desktop, return visitors vs new)
Test multiple page versions via A/B testing
Implement feedback loops (user testing + analytics)
Integrate with AI tools to auto-adjust elements based on trends
(Suggested resource: “How to Use AI to Enhance Funnel Design")
Common Mistakes Businesses Should Avoid
❌ Ignoring Bounce and Exit Rate Patterns
Many businesses overlook behavior tracking or misinterpret bounce and exit rates. Bounce rate refers to users who visit a page and leave without interacting, while exit rate refers to the percentage of users who leave your site from a specific page—even if they visited others first. High exit rates on important pages (like checkout or contact) could signal broken layouts, missing trust signals, or confusing navigation.
❌ Not Setting Conversion Goals
Failing to define and track conversion goals means you’re flying blind. Whether it’s a form submission, appointment booked, or sale completed, you need to explicitly track key outcomes to measure page effectiveness and optimize accordingly. Without these benchmarks, it’s impossible to identify bottlenecks or measure success.
❌ Focusing Only on Traffic Volume
Traffic alone doesn’t equal success. Many marketers obsess over vanity metrics like page views without considering whether visitors are engaged or converting. A small audience that converts well is far more valuable than high traffic with poor performance.
❌ Not Optimizing for Device Type
Mobile traffic accounts for over 50% of global website visits. If your site isn’t responsive, optimized, and easy to navigate on phones and tablets, you’re potentially losing half your leads. Go High Level allows you to segment analytics by device type—use it.
Final Thoughts
Go High Level’s website analytics isn’t just a performance-tracking tool—it’s a strategic design compass. When used correctly, it transforms vague design decisions into targeted, ROI-boosting improvements. Whether you’re adjusting a headline, simplifying a layout, or fixing a high-dropoff funnel step, the data guides you to what actually matters.
By combining real-time behavioral insights, conversion tracking, source attribution, and design iteration, you’re equipped to design with purpose and precision.
