By Ozlon
What should a roofer learn from website analytics?
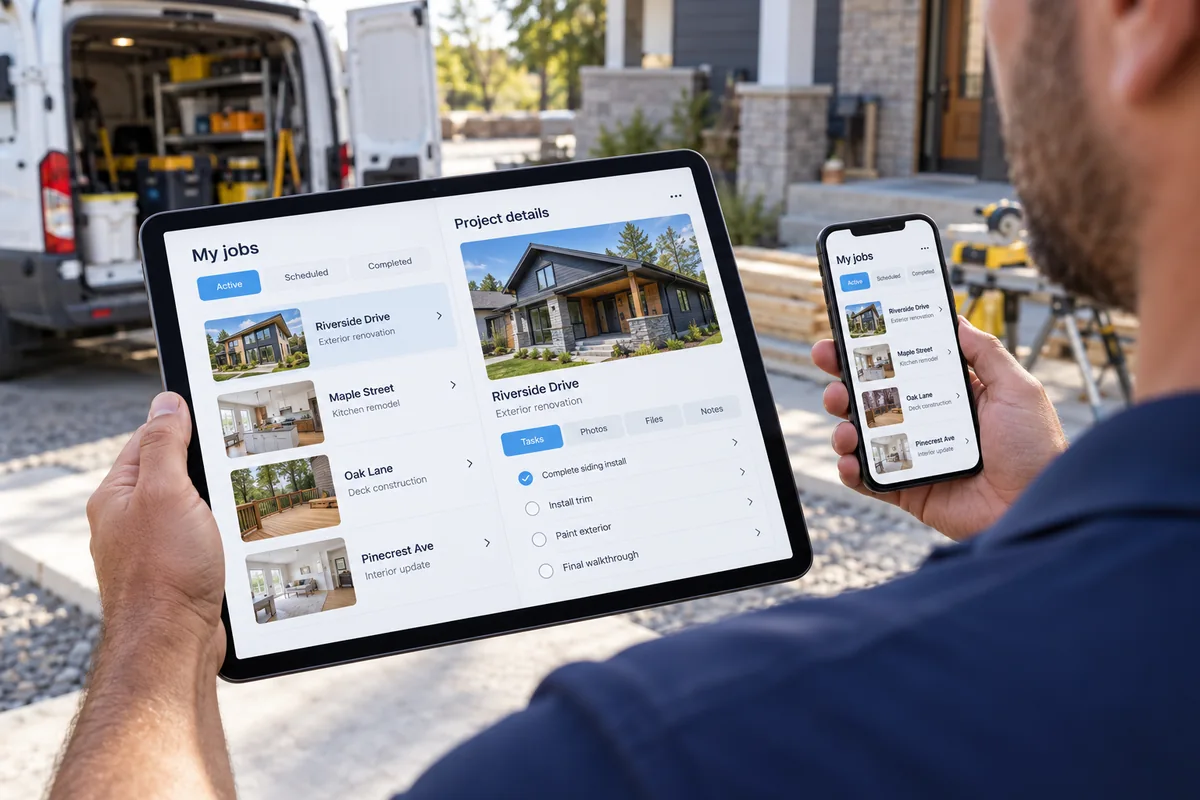
After a storm, a homeowner on a roof repair page needs clear answers and a usable next step, not a traffic tally. For a roofer, website analytics can compare page visits, calls, forms, and device behavior. Use those signals to choose a change that addresses an observed problem rather than a hunch.
Start with one service page and one action, such as calling to request an inspection. Track whether people reach the page, tap the phone link, or submit a request. Then review the page itself and the lead record. Analytics describe activity; they do not explain every visitor's reason or promise more jobs.
What is at stake when the page is hard to use?
A homeowner comparing roofers may need to confirm that you handle storm damage, see the towns you serve, and find a working phone number. If those details are buried, the visitor may leave without contacting you. A 2026 consumer search study found that 85% consider contact details and opening hours important when researching a local business. The survey does not predict calls for a roofing company, but it supports keeping those details easy to verify. See Consumer Search Behavior, 2026.
There is also a quieter cost: a team can spend time redesigning a page without knowing what customers struggled to find. A measurement plan helps separate a weak call path from low demand, a form fault, or visitors outside your service area.
How can you read behavior without overreading it?
- Choose one business question. For a roofer, ask whether the storm damage page gives a mobile visitor a clear way to request an inspection. Avoid trying to fix every page at once.
- Define the action. Count completed forms or tracked phone taps as separate actions. Do not treat a page view as a qualified lead. Record what counts as a new inquiry and how duplicates are handled.
- Compare useful slices. Separate mobile and desktop visits, service pages, and local areas only when the underlying records support that view. A combined average can hide a broken button on one device.
- Inspect the page and lead. If people visit the page but few tap to call, check the phone link, heading, service description, and mobile layout. If requests arrive but are not followed up, the issue may sit in the handoff rather than the page.
- Change one thing and log it. Move the phone option or clarify the inspection request, then compare the same measures over a consistent period. Note other changes, such as weather or an advertising campaign, that could affect the comparison.
- Review with a person. Read a sample of inquiry records and ask the office or estimator what customers needed. Never infer sensitive personal details from browsing behavior.
For example, imagine a roofing company in Charlotte sees visitors reaching its storm damage page on phones, but the call option sits below a long block of text. The owner could place a clear phone link near the first service explanation, test it on a phone, and track taps and completed inspections separately. This is a hypothetical test, not a reported client result. A spike in taps alone would not prove the page caused more booked work.
Keep measurement proportionate. Use data the business needs, explain tracking where required, and avoid collecting details simply because a form can ask for them. A heatmap or recording may help locate a layout issue, but it does not replace asking customers or checking actual records.
How we decide
We would compare service page visits with call logs, form submissions, device type, service area, and the next recorded action. That can show where a question belongs: page clarity, mobile usability, lead routing, or staff follow up. We would first check whether the same definitions were used across the period, then recommend a change only where the evidence points. Ozlon provides local SEO services and web design; the right scope depends on what the records show.
What questions do roofers ask about site analytics?
Which website metric should I watch first?
Start with the action tied to your goal, such as a completed estimate request or a call from a service page. Keep page visits as context, not as the result.
Do heatmaps tell me why a visitor left?
No. They can show where visitors clicked or scrolled, if the tool captures that data, but they cannot establish intent. Review page content and customer feedback as well.
How often should I review the numbers?
Choose a repeatable schedule that fits your inquiry volume. Compare like periods and write down site changes, campaigns, and unusual weather before drawing a conclusion.
What is the next step?
Choose one roofing service page and test its call and form path on a phone. If you want help connecting that page to the inquiry process, ask Ozlon to review your website and lead path. Bring one example of a customer question and the action you want the page to support.
How this was made: written by the Ozlon team from our own method, with every outside figure checked against its source.